Hi all! In this article, we will talk about the tools for analyzing mobile applications that we use every day. First, let’s talk about how to launch mobile applications, how to watch traffic, and also consider tools for static and dynamic analysis of mobile applications.
Devices
Real device
At Yotec, approximately 80% of audits are conducted on real devices. This gets rid of a lot of problems. Right off the bat, I can name the following problems that the use of a real device solves:
- It is easier to pass environment attestation if one is implemented in the application
- Useful resources are not wasted on the working machine
- There are applications in which some functionality is moved to native libraries, and at the same time they are compiled only for the ARM architecture. Most virtual devices are x86_64 or x64; Android Studio has an ARM device, but the Android version and performance leave much to be desired
- The performance of the emulator is always slower than that of the real device
We mainly use Samsung with Android 12, a couple of Xiaomi and pixels. We also recently got a tablet on Harmony OS.
virtual device
Android Studio Emulator

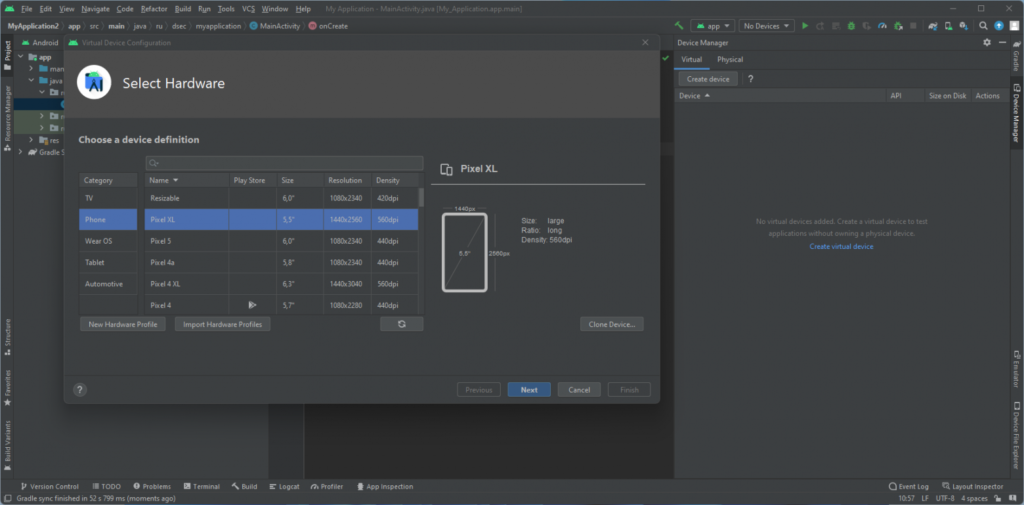
To create a virtual device, we create an empty project in Android Studio, select the Tools tab, where we need the Device Manager tool. A side tab with devices will open.
In the next step, we can choose from two versions – with and without Google Play. If you select the first one, then you will not be able to exit the mode with superuser rights.
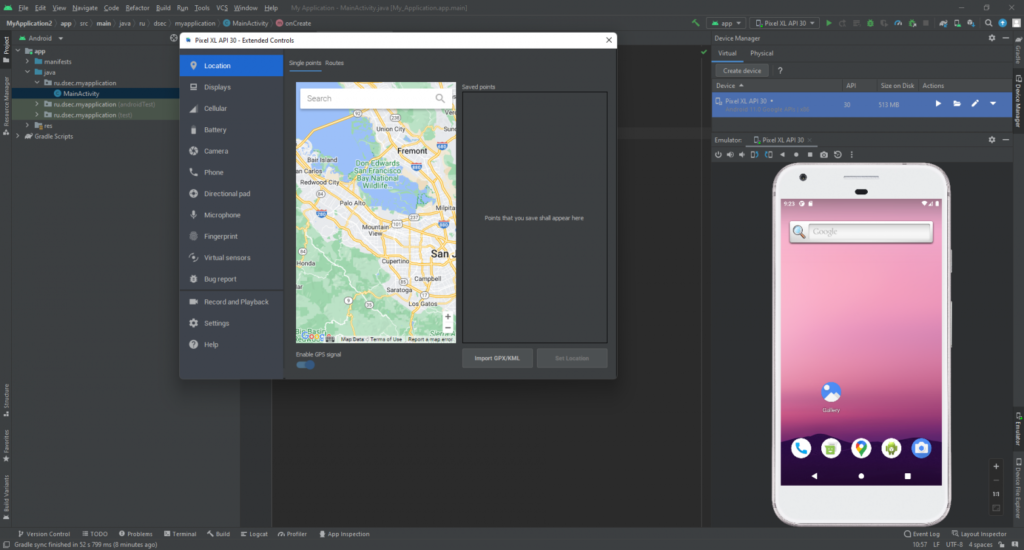
After downloading the necessary files, your device will appear on the Device Manager tab. We can launch.
Proxy
The analysis of mobile applications is inextricably linked with the analysis of traffic between the server and the client (mobile application). There are many (none) tools available for this. But we mostly meet three. About them below.
BurpSuite
This is our main tool, which is almost always running. As strange as it may sound, it has the cleanest interface and everything you need out of the box. Distributed in two versions – Community and Professional. For basic analysis, the first version is enough, and you can always add the necessary extensions through the Extender.
MitmProxy
A console tool that, like Burp, allows you to wrap traffic in it and study it. There is also a web interface, but other functionality is more interesting.
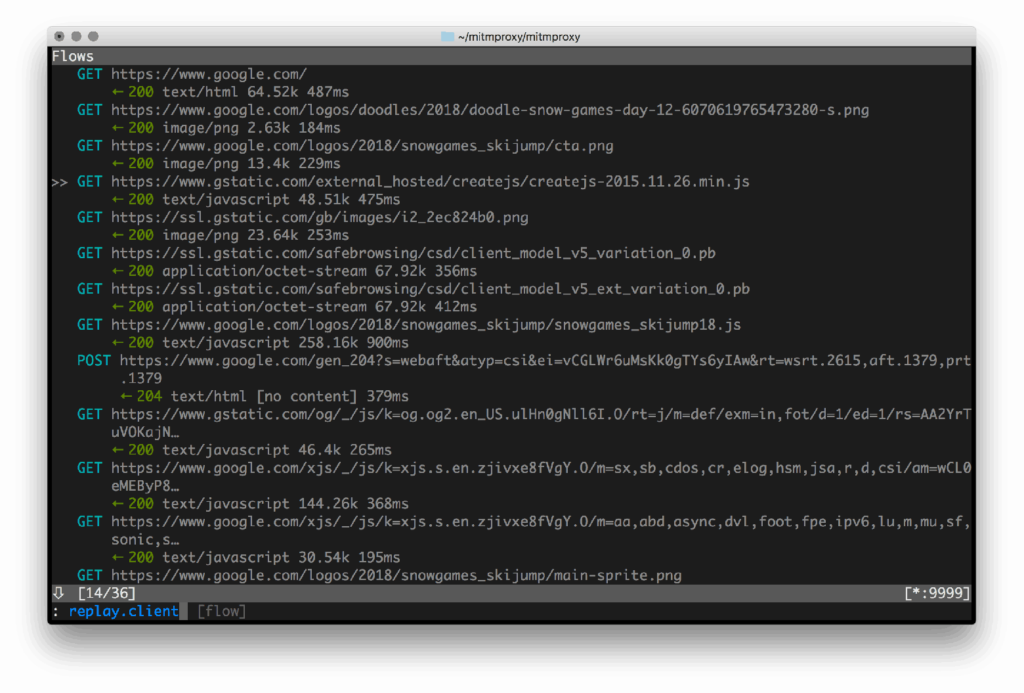
MitmProxy makes it easy to add functionality using the Python API. For example, we had a case when encryption of data sent via web sockets was implemented, and we wanted to look at them. And even more I wanted to modify them.
In just a few minutes, a script was written that decrypted the data (we had the necessary keys), passed them on to Burp, which was listed as an upstream proxy, and there was another upstream proxy that encrypted the data and transferred it to the backend.
It turned out something like this flow:

OWASP ZAP
Another powerful tool that is almost as good as BurpSuite. Its only minus is a billion settings in which you can endlessly search for the necessary checkbox.
I would like to highlight one of the functions that is not in BurpSuite and which is sometimes necessary at the same time – the ability to set a breakpoint for web sockets. In the modern world, there are sites or applications in which almost all client-server interaction is based on web sockets. In BurpSuite, you can turn on the Interceptor and click through each message until the one you want appears that you want to modify and send further. But what if there are dozens or hundreds of such messages? This is where this functionality comes in handy.
You can add a breakpoint on the tab with websockets. We define the type of data to be transferred and the data to search.
Static Analysis
JADX
A tool that almost all mobile application security analysts and not only are familiar with. This is a real must-have when analyzing applications. While we spend 70% of our time in BurpSuite while studying traffic, JADX is open 80% of the time when we study a mobile app in a “black box”.
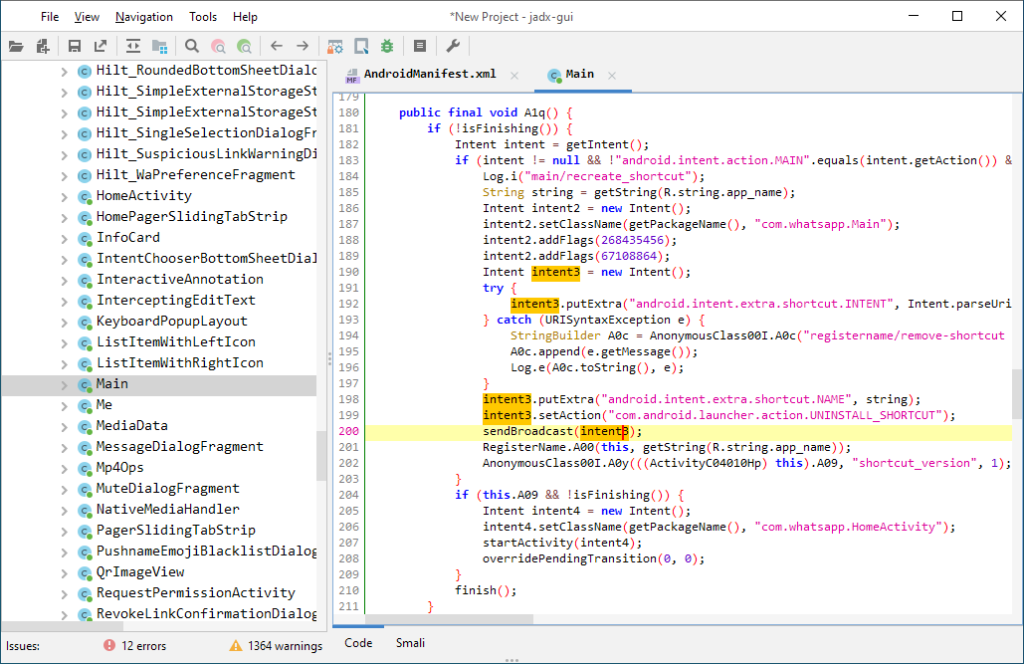
Allows you to decompile code on the fly, view classes, resources, and search the entire application. A real harvester in the best sense of the word.
It also allows you to connect to the application in debug mode and set breakpoints.
Apktool
It is used in exactly two cases – when you need to get the resources or assets used, and also when JADX does not have enough memory to open and decompile the entire application in order to search for it. In this case, we unpack the application using apktool, search with the usual grep / ripgrep and open the class either in jadx or a file with smali code in any text editor.
ByteCode Viewer
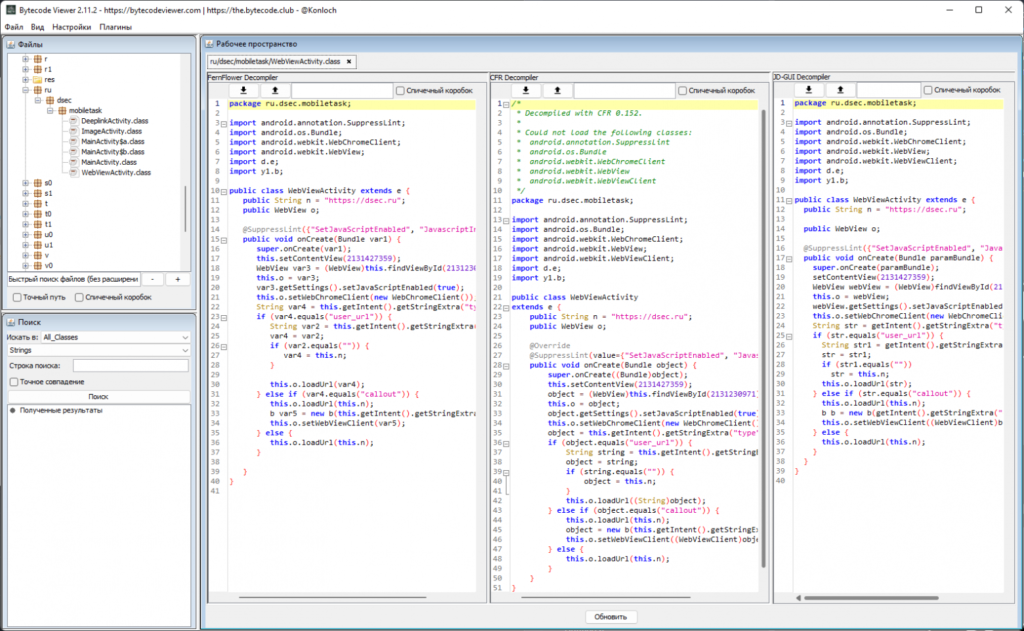
All-In-One tool for analyzing mobile applications. You can upload an APK and compare the results of several decompilers at once. It is very useful when JADX cannot bring some methods to normal form, and nothing is clear through smali 🙂
Androguard
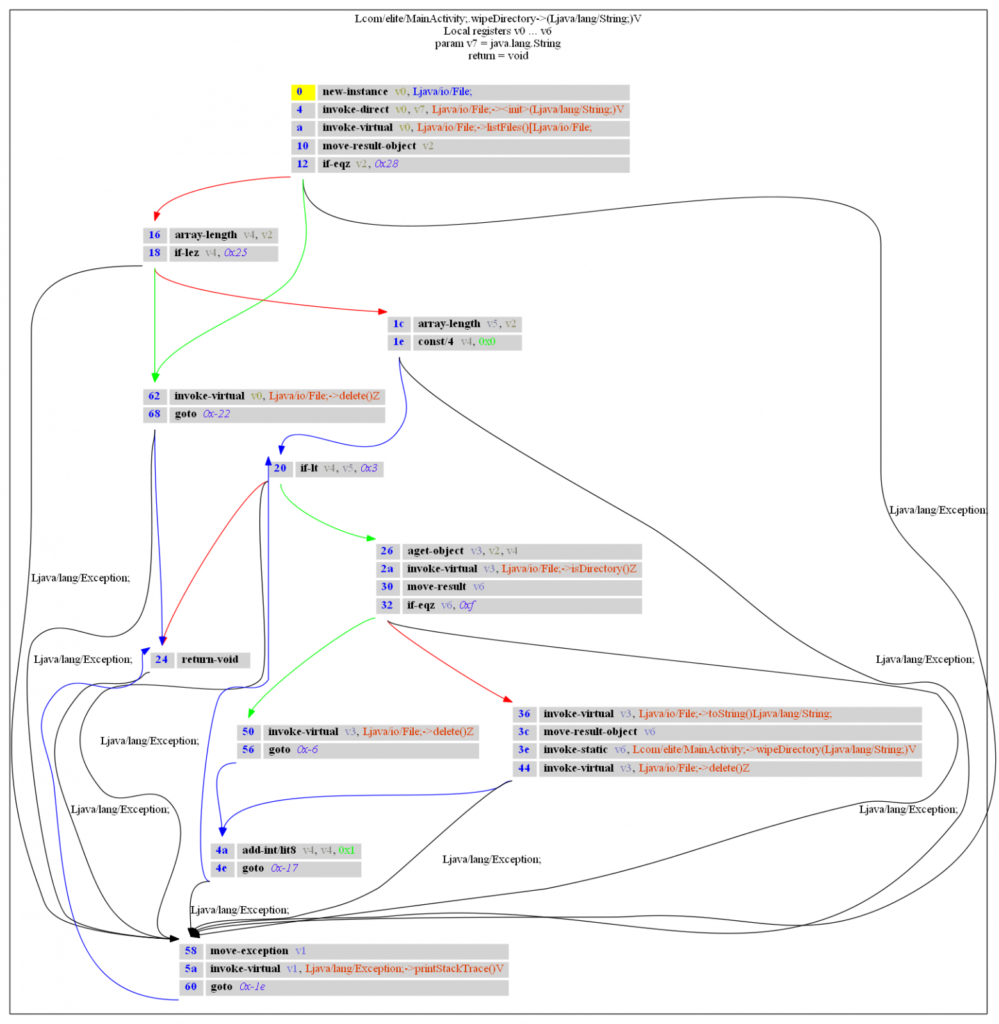
A very powerful tool for reverse engineering mobile applications. Used it a few times to automate checks when it was necessary to go through functions and XREFs.
He also knows how to draw graphs for classes, which can visually help to understand the flow of the mobile application.
One of the most “fresh” tools for analyzing mobile applications. Performs Taint analysis on Dalvik bytecode. Easy to install, out of the box it already has some set of checks that will help you find low-hanging vulnerabilities. Naturally, it is better to write your own rules for each project – this will increase the effect of the analysis and save time.
The main thing is to take into account that if your application is large and has a lot of functionality, then you need to stock up on time and patience – the analysis can take up to half an hour. Another thing I noticed: mariana trench does not take into account whether the component is exported.
Let’s imagine a basic vulnerability when we have a deep link processing in an activity, a parameter is taken from it urland passed to the function loadUrlof some webview. Mariana Trench will highlight this as a vulnerability, but if we have a non-exportable entry point (Activity), then it will be False Positive.
Although it is worth bearing in mind, you cannot write this in a report.
hbctool
https://github.com/bongtrop/hbctool
https://suam.wtf/posts/react-native-application-static-analysis-en/
Console utility for working with Hermes bytecode. One of the popular frameworks for cross-platform development is React Native. When you analyze such an application, you have three scenarios:
- The file
./assets/index.android.bundlewill contain minified javascript code, which you can try to run through the beautifier and read. - Next to the file
./assets/index.android.bundlethere will be a file./assets/index.android.bundle.mapwith mappings for the compiled file, and you can use https://github.com/rarecoil/unwebpack-sourcemap to unpack it and read the original source code. - The file
./assets/index.android.bundlewill be binary. This is Hermes Bytecode.
This tool is for emergencies. With it, you can try to turn the code into the so-called HASM. It’s still hard to read, but it’s clearly better than the binary. And through blood and tears, you can try to study the logic of the work, change it and put it back together.
Dynamic Analysis
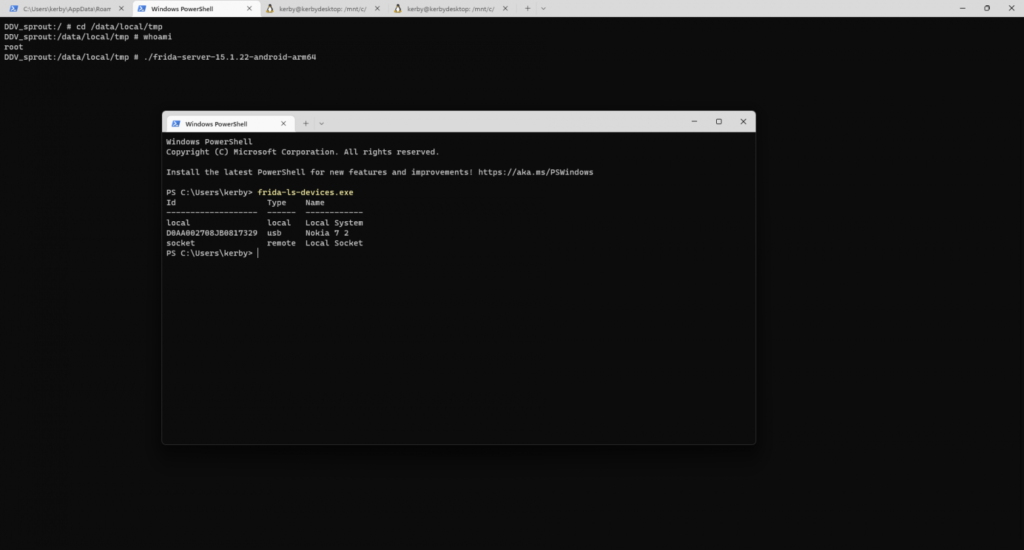
The most famous tool that allows you to connect to the application on the fly and inject your code into it. If compared with something for its intended purpose, then only the Xposed Framework comes to mind. If compared in time, then writing a script for Frida takes much less time than a module for Xposed.
To install the necessary things on the host, you need to run the following simple command:
pip install frida-toolsDownload frida-server for the desired architecture, transfer it to the device and run it with superuser rights:
su
cd /data/local/tmp
/data/local/tmp/frida-server-15.2.2-android-arm64
After that, we will be able to see it in the console and start writing scripts for applications.
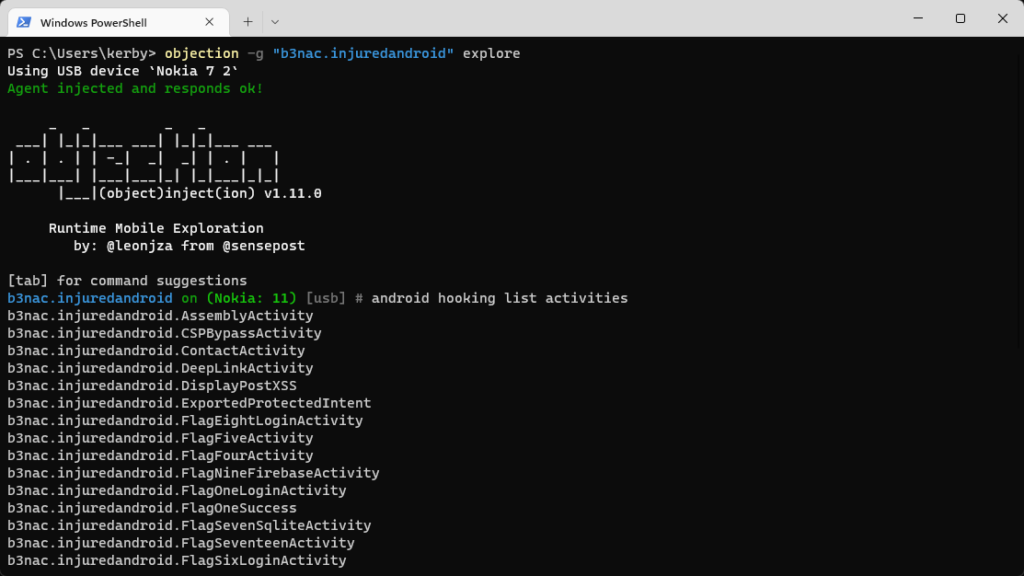
Objection is a toolkit that is based on Frida and provides ready-made functions for working with mobile applications. Has the following out-of-the-box features:
- Working with the file system
- Bypass SSL-pinning
- Dump keychain & keystore
- Working with memory
- Intent Manipulation
Installation:pip3 install objection
Launch:objection -g "package_name" explore
medusa
In my opinion, this is the underground among tools for analyzing mobile applications. He is rarely mentioned, which is very in vain. This is the largest collection of Frida scripts I have ever seen. It can be compared with metasploit in approach: you have a collection of scripts, you select the necessary ones, they are compiled together and injected into the process.
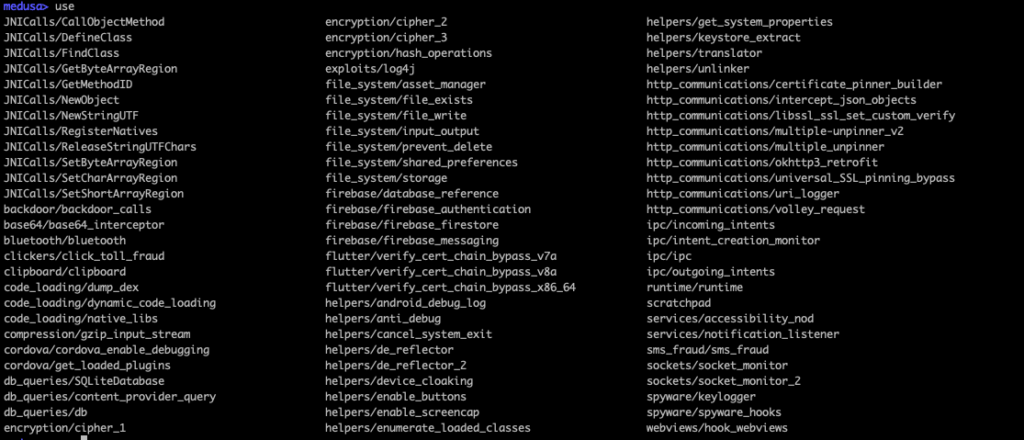
Very convenient and sometimes saves a lot of time. However, a couple of times there were typos and errors in the modules, because of which the scripts broke, so I had to edit them manually 🙂
Magisk modules
If you look at the Magisk modules, there are not so many that we need that save time.
MagiskTrustUserCerts
This module is MagiskTrustUserCerts. Modern versions of Android do not allow you to add a system CA. This must be done manually or with the help of such modules that, at the stage of system boot, will transfer client certificates to the system directory. This is necessary so that applications trust us when we wrap traffic to a proxy for further analysis.
This module was already mentioned by us when we configured WSA.
XPosed modules
Due to the obsolescence of the original XPosed, we use its fork – LSposed. This fork is a module for Magisk, which is why the installation is done in just a few clicks.
WebViewDebugHook
Little can be written about this module, but it does literally the following:
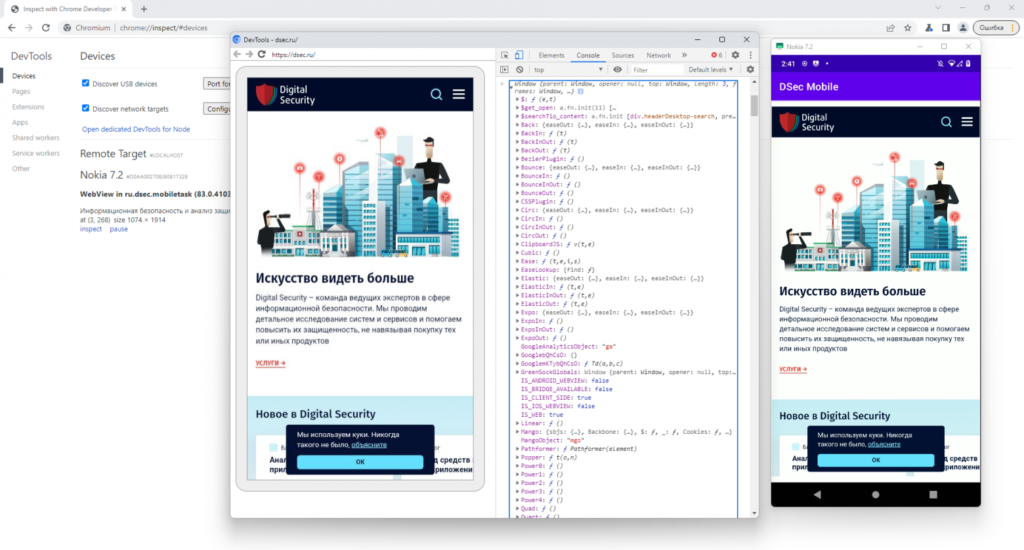
WebView.setWebContentsDebuggingEnabled(true);It is convenient if the application uses a WebView and you need to look at it “from the inside”.
We install this module, through LSposed we select the scope of applications to which this module will be distributed.
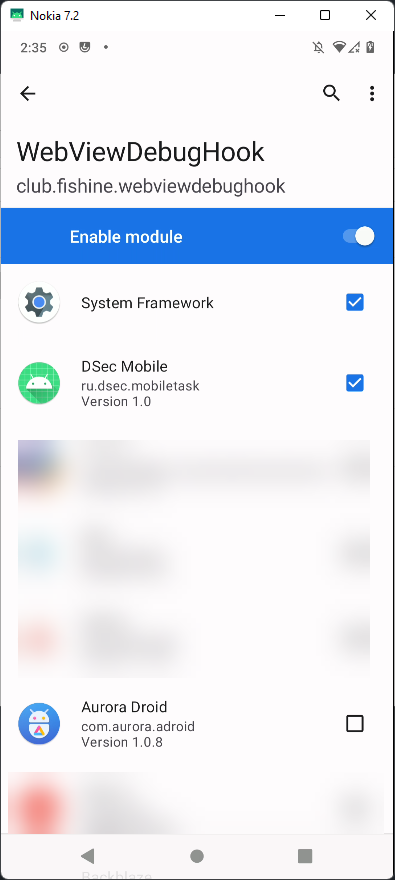
Now that we have a WebView on the active screen, we can look at it through Chrome ( chrome://inspect).
Xintent
This module allows you to see how the system works with intents exchanged between applications or application components. If you want to understand better the logic of the application in dynamics, then this is a great option.
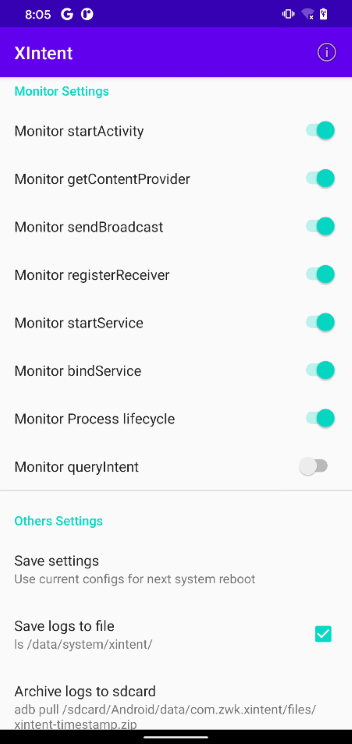
As before, you need to select the target application – and go ahead to look at the logs.

adb
It’s probably strange to see ADB here, but it’s impossible not to mention it. He can do a lot and plays the role of almost the main tool when interacting with the device.
Port forwarding
# пробрасываем 7777 порт на устройстве, чтобы трафик шел на 8080 порт хоста
adb reverse tcp:7777 tcp:8080
Manipulating settings
With the commands below, you can specify an HTTP proxy and remove it accordingly.
adb shell settings put global http_proxy 127.0.0.1:7777
adb shell settings put global http_proxy :0
Current on-top activity and fragment
adb shell "dumpsys activity activities | grep mResumedActivity"Display a list of all applications and the path to the base APK
adb shell pm list packages -fADB logcat by package name
linux:
adb logcat --pid=`adb shell pidof -s com.example.app`

windows:
adb logcat --pid=$(adb shell pidof -s ru.dsec.mobiletask)
Launch intent
Basic example:
adb shell am start -a android.intent.action.VIEW -d "dsec://open"amknows almost everything. It has a long but extremely clear manual 🙂


About The Author: Yotec Team
More posts by Yotec Team